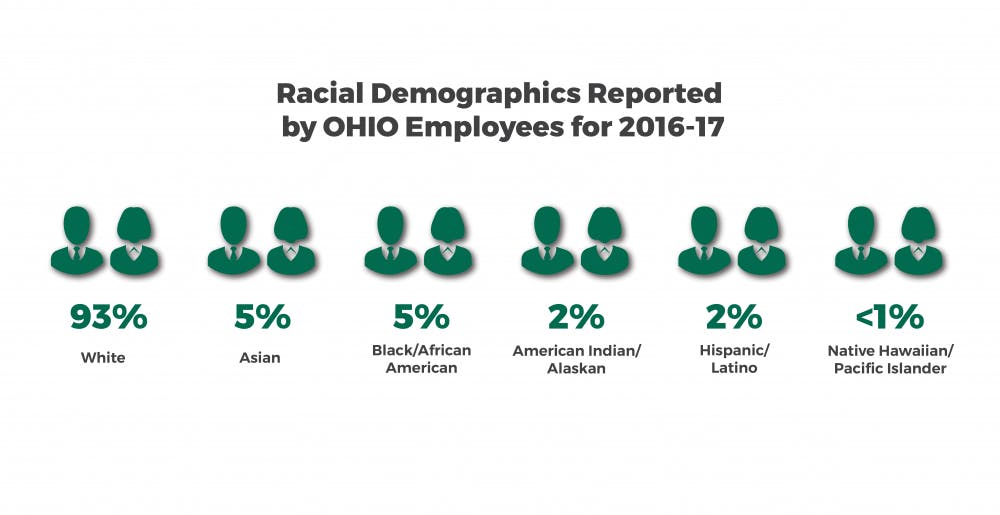
Approximately 93 percent of Ohio University employees who reported their race in a recent survey are white — less than a 1 percent decrease from the previous year, according to data released by the university in response to a Post public records request.
Of the university’s total of 6,351 employees, 1,709 — approximately 27 percent — did not report race or ethnicity for 2017.
About 54 percent of university employees identify as female, equaling a 1 percent jump from the previous year’s numbers. As of 2017, the age of the average OU employee is 47.
Here’s how the racial demographics of OU employees break down, according to the reported data:
Hispanic/Latino
Between the 2016-17 and 2017-18 academic years, the university hired three new employees who identify as Hispanic/Latino.
Of all 91 employees who reported identifying as Hispanic/Latino, 59 are faculty members, seven are classified workers and 25 are administrators.
Despite the new hirings this year, the total ratio has remained the same — Hispanic/Latino employees account for 2 percent of all university employees.
The average salary for Hispanic/Latino employees who reported is $49,114.
American Indian/Alaskan
This year, a total of 61 university employees reported as identifying as American Indian/Alaskan, accounting for approximately 2 percent of the total employee population.
No new employees who reported identifying as American Indian/Alaskan were added in the past year.
Of the 61 employees, 16 are administrators, 19 are faculty members, 25 are classified workers and one works in research. The average salary for American Indian/Alaskan employees who reported is $28,960.
Black/African American
A total of 196 university employees reported as identifying as black/African American, accounting for approximately 5 percent of the total employee population.
Of those employees, 62 are administrators, 32 are classified workers, 101 are faculty members and one works in research.
Overall, since the past year, the university lost six employees who reported identifying as black. The average salary for black employees who reported is $41,506.
Asian
As the largest demographic to identify as non-white, employees who reported identifying as Asian account for 5 percent, or 198 individuals, of the university’s total employee population.
Of those, 35 are administrators, six are classified workers, 136 are faculty members and 21 work in research.
Staffing levels decreased by one individual within the past year. The average salary for Asian employees who reported is $65,361.
Native Hawaiian/Pacific Islander
Eight OU employees reported to identify as Native Hawaiian/Pacific Islander, equaling less than 1 percent of the total employee population.
Of those eight, four are faculty members and four are administrators. Over the past year, the university added one new employee who reported identifying as Native Hawaiian/Pacific Islander.
The average salary for Native Hawaiian/Pacific Islander employees who reported is $35,522.
White
A total of 4,088 OU employees identify as white, making them the most heavily represented demographic group at 93 percent of the total population.
Of those, 1,232 are administrators, 951 are classified workers, 1,863 are faculty members and 42 work in research.
Over the past year, the total number of employees who reported identifying as white went down by 38. The average salary of white employees who reported is $38,325.


